

Running MIL and SIL
This chapter explains what happens when you press Run: how logical time advances, how a session moves between running, paused and stopped, how to watch values live, and where the results are stored.
Logical time, ticks and batches
- The System advances in ticks. A tick is the base step, typically 10 ms. Components can update every tick or every n-th tick (Timing → Update every (ms)).
- Ticks per run (1–1000) sets the batch size. Run executes one batch as fast as possible and then pauses. 100 ticks at 10 ms is 1 s of logical time.
- Within a tick, components run in the order shown by Check, and connected values are exchanged in that order. The result is deterministic: the same saved System and inputs give the same samples.
- Logical time is not wall-clock time. A run can be faster or slower than real time, depending on the models and your PC.
For runs longer than 1000 ticks, select Continue repeatedly, use a scenario (up to 100,000 ticks per campaign), or use Coordinated SIL (up to 10,000 ticks per run, cancellable). Entering a larger number gives Choose 1–1000 ticks. For a cancellable 10000-tick run, open Coordinated SIL / deployment.
Session states
| State | How you get there | What you can do |
|---|---|---|
| No session | New project, or after Reset & release session | Edit structure and values. Check, Run. |
| Running | Run or Continue | Watch. Cancel run or Stop. |
| Paused | A batch completed, or Step | Continue (next batch from the same state), Step (one tick), Results, Stop, Reset. |
| Stopped | Stop | Results are kept. Release the session to edit, or start a new run. |
| Faulted | A component or host failed | Read Diagnostics, then Stop and Reset. |
The top bar always shows the state, for example MIL · Running · 72.20 s, MIL · paused · 1.00 s or MIL · stopped · 271.00 s. Its Stop button requests a controlled stop of the System session. It is a software stop, not an emergency stop.
Run from System Engineering
- Choose the profileSelect MIL or SIL above the canvas.
- CheckSelect Check and fix any finding.
- RunSet Ticks per run and select Run. The Execute bar changes to Continue, Step, Reset, Stop, and Reset & release session appears.
- ObserveUse Live debug during the run and Results afterwards.
- FinishStop ends execution but keeps the session's results. Reset & release session stops and releases the session so you can edit again.
| Button | Effect |
|---|---|
| Run / Continue | Checks (first time) and runs one batch. Continue runs the next batch in the same session. |
| Step | Advances exactly one tick and pauses. |
| Run to completion | Shown only for projects that define a completion output, for example a charge target. Runs until it is reached. |
| Cancel run | Interrupts a batch in progress. Committed ticks are kept. |
| Reset | Returns the models to their initial state and starts a new segment in the same session. The local trace is cleared, so export first if you need it. |
| Stop | Stops the session. Results remain available. |
| Reset & release session | Stops and releases the session so you can edit structure and values. |
Live debug
Live debug opens the Live Session Debug panel. It shows the progress of the current batch (100 / 100 committed ticks) and a table of recent samples: source, logical time, signal, value and unit.
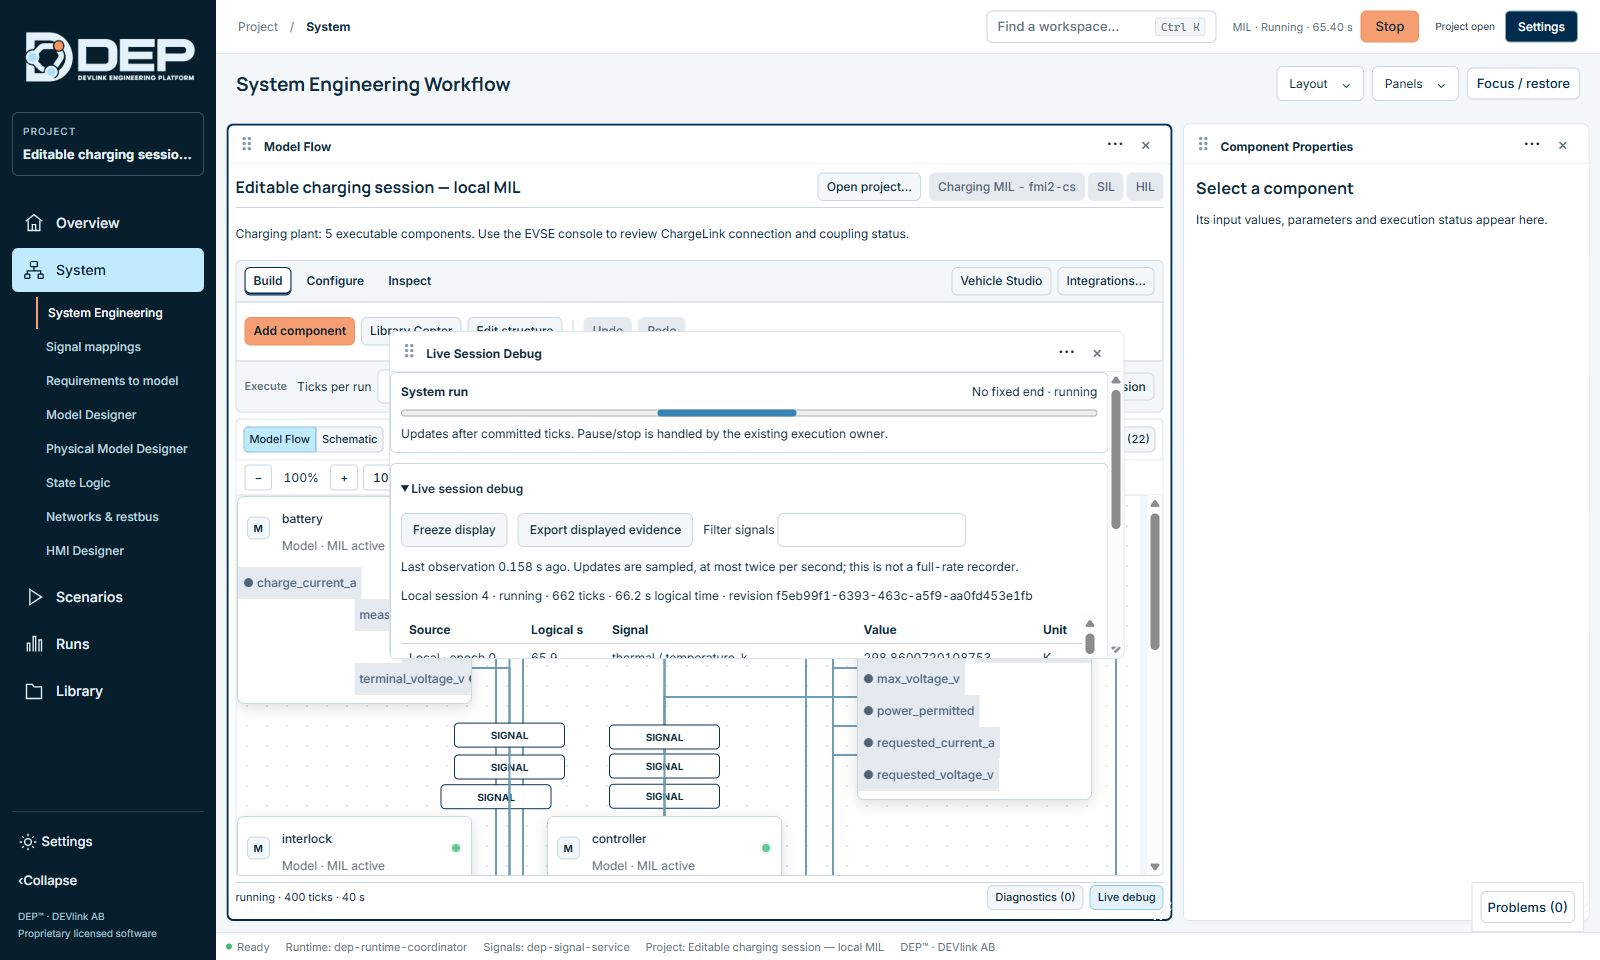
- Filter signals narrows the table.
- Freeze display stops the table from updating while you read it. Execution continues.
- Export displayed evidence saves what is shown as
DEP-live-debug.json. - The panel samples at most twice per second. It is not a full-rate recorder, so use Results for every sample.
Results
Results opens Run results: choose a run (Run 1 · paused · 100 ticks) to see its status, completed ticks, logical time and every recorded output sample (segment, time, component/output, value with unit). Configuration and evidence identity shows exactly which revision and implementations produced the run. Bus traffic appears under Virtual bus communication.
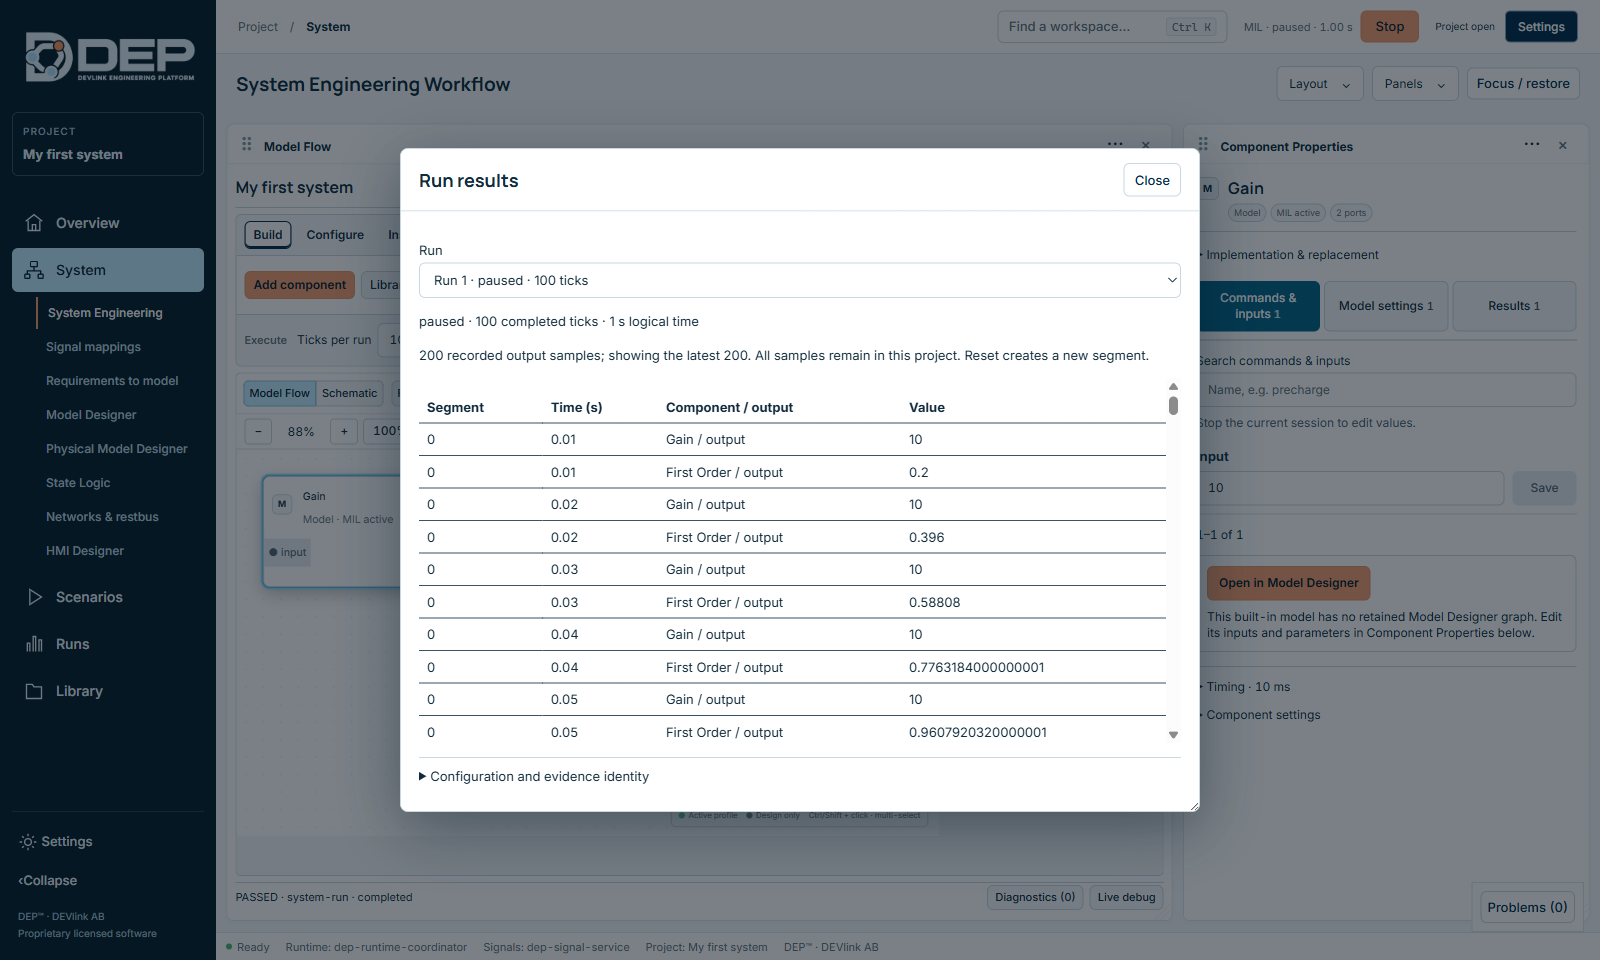
All samples stay in the project. For plots, comparisons and exports, use Results and Recordings.
Execution Center
Runs → Execution & HIL shows the same session from an operator's point of view, independent of the canvas.
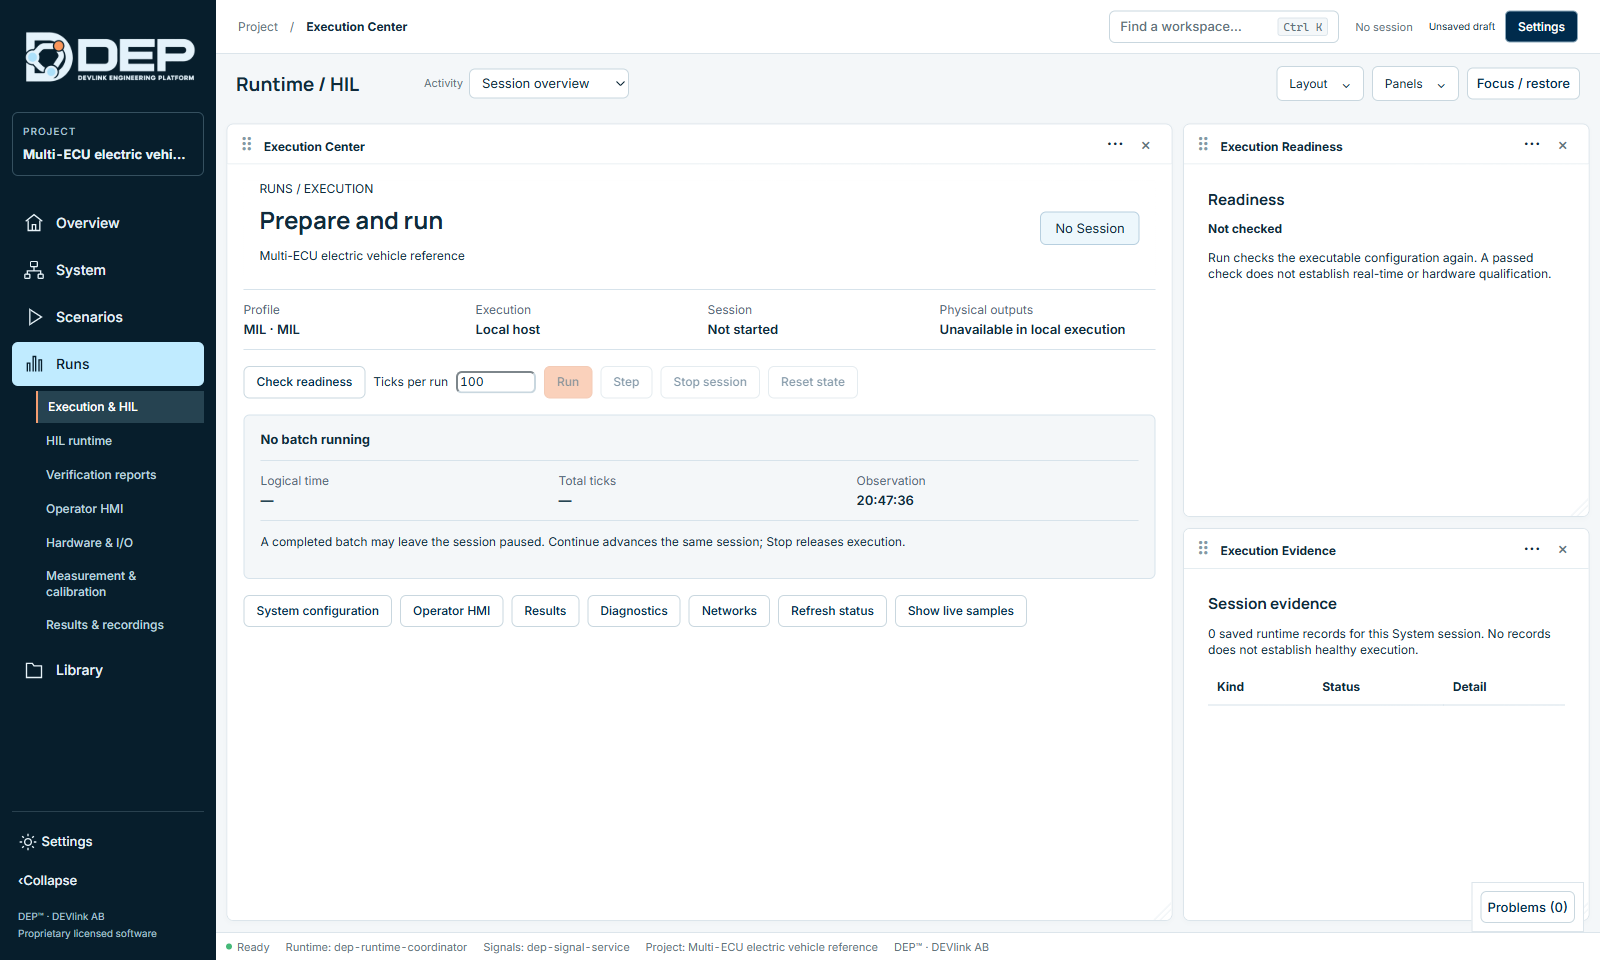
- Cards: Profile, Execution (Local host), Session, Physical outputs (Unavailable in local execution).
- Controls: Check readiness, Ticks per run, Run, Step, Stop session, Reset state.
- Progress: Logical time, Total ticks, Observation (the wall-clock time of the last update).
- Shortcuts: System configuration, Operator HMI, Results, Diagnostics, Networks, Refresh status, Show live samples.
- Execution Readiness: the latest readiness result.
- Execution Evidence: the runtime records saved for this session. No records does not establish healthy execution.
The Activity selector of this workspace also offers Target inspection, Signals and events, Software execution (start, restart and stop software processes and verify their SHA-256), Saved evidence, Reference example and Diagnostics (the Diagnostics Center).
One execution owner at a time
Only one part of DEP may drive execution at any moment: a System session, a restbus acquisition, a scenario campaign, an HMI-started run or a HIL deployment. If you start a second one, DEP refuses with Another runtime owns execution. Stop it in its owning workspace… (DEP-RUN-OWNER), and nothing changes.
- The status chip in the top bar always shows the current System session.
- Restbus acquisition is stopped with Pause in Networks & restbus → Traffic / Streaming.
- Software processes are stopped in Runs → Execution & HIL → Software execution or with Stop application in Component Properties.
- HIL deployments are stopped in Runs → HIL runtime.
Evidence and storage
- Every session records its configuration identity, samples and frames in the project file.
- The default budget is 2,000,000 rows or 512 MiB per project. Change it in Run options → Evidence storage limits. When the budget is reached, recording stops with
DEP-EVIDENCE-LIMITand no samples are silently dropped. - Recent sessions are listed on the Overview under Recent System sessions.