

Results and Recordings
Every session in DEP records evidence: model output samples, bus frames, markers and the identity of what ran. Runs → Results & recordings lets you inspect that evidence, compare runs, record and replay traffic, and export data. This workspace never invents a successful run: if nothing was recorded, it says so.
Activities
The workspace has two activities: Results / Analysis and Runs / Recording / Replay.
Results / Analysis
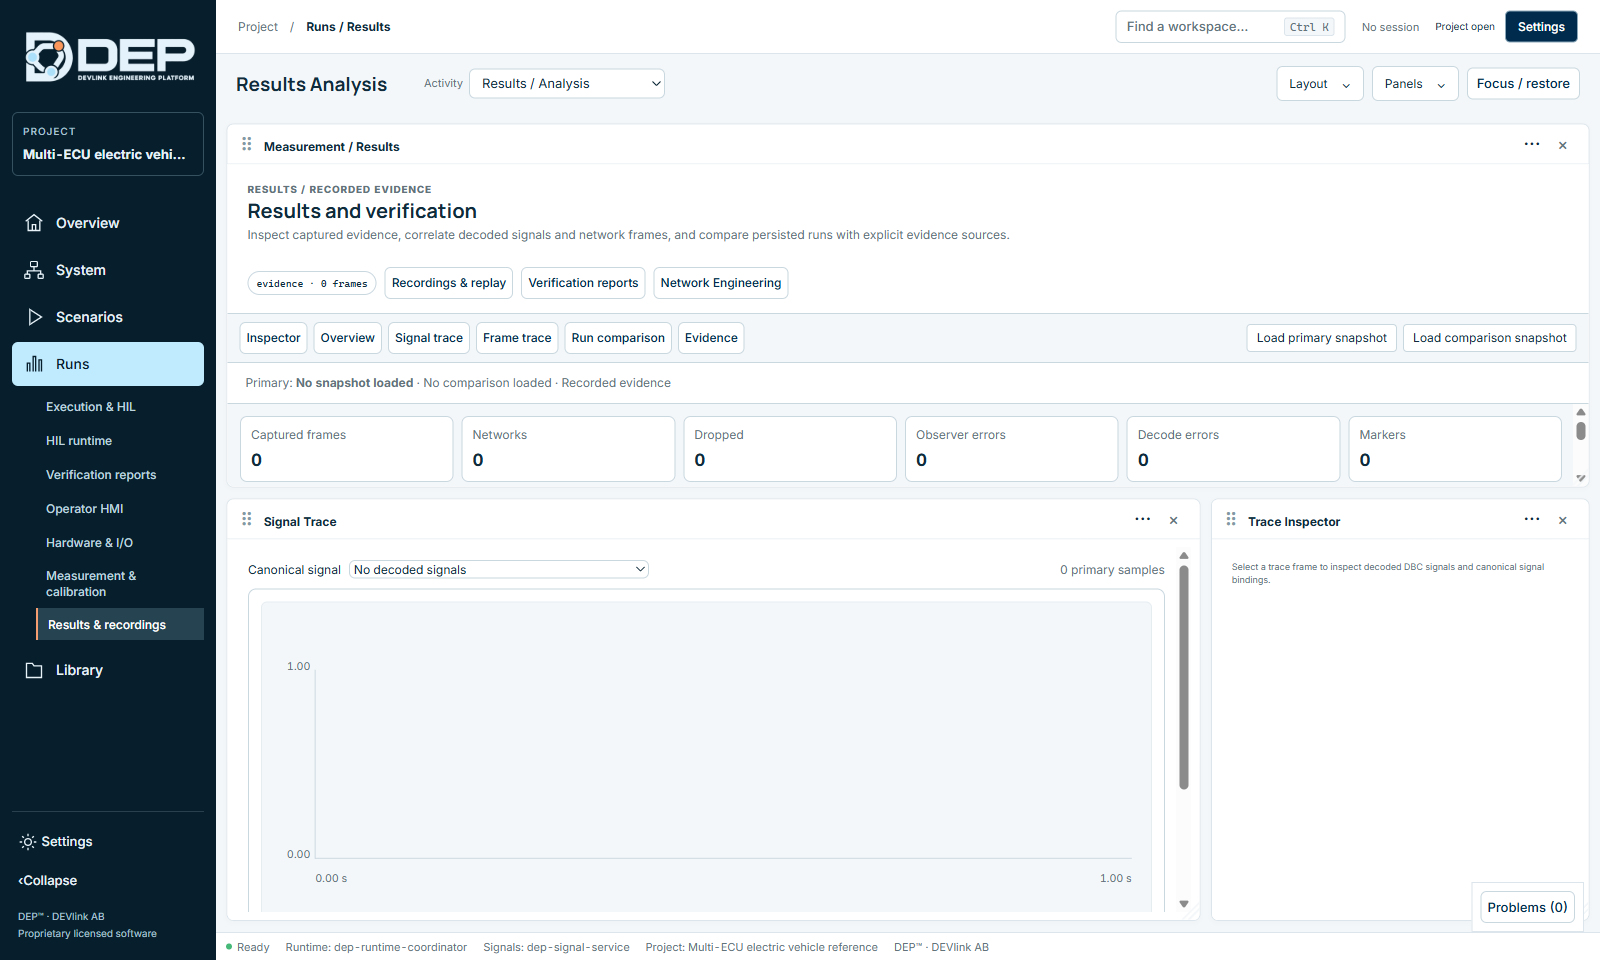
Tabs: Overview, Signal trace, Frame trace, Run comparison and Evidence. Links to Recordings & replay, Network Engineering and the Inspector.
- Load a runSelect Load primary snapshot and choose a saved DEP measurement trace snapshot. Files up to 50 MB are accepted.
- Read the overviewCaptured frames, networks, dropped frames, observer errors, decode errors and markers.
- Plot signalsOn Signal trace, choose a canonical signal. Primary and comparison runs share logical-time and value scales.
- Inspect framesOn Frame trace, select a frame. The Trace Inspector decodes its DBC signals and canonical bindings.
- CompareSelect Load comparison snapshot and open Run comparison to see the differences. Export comparison CSV writes them to a file.
Quick per-session results are also available directly in System Engineering (Results) and on the Overview (Recent System sessions). See Running MIL and SIL.
Runs / Recording / Replay
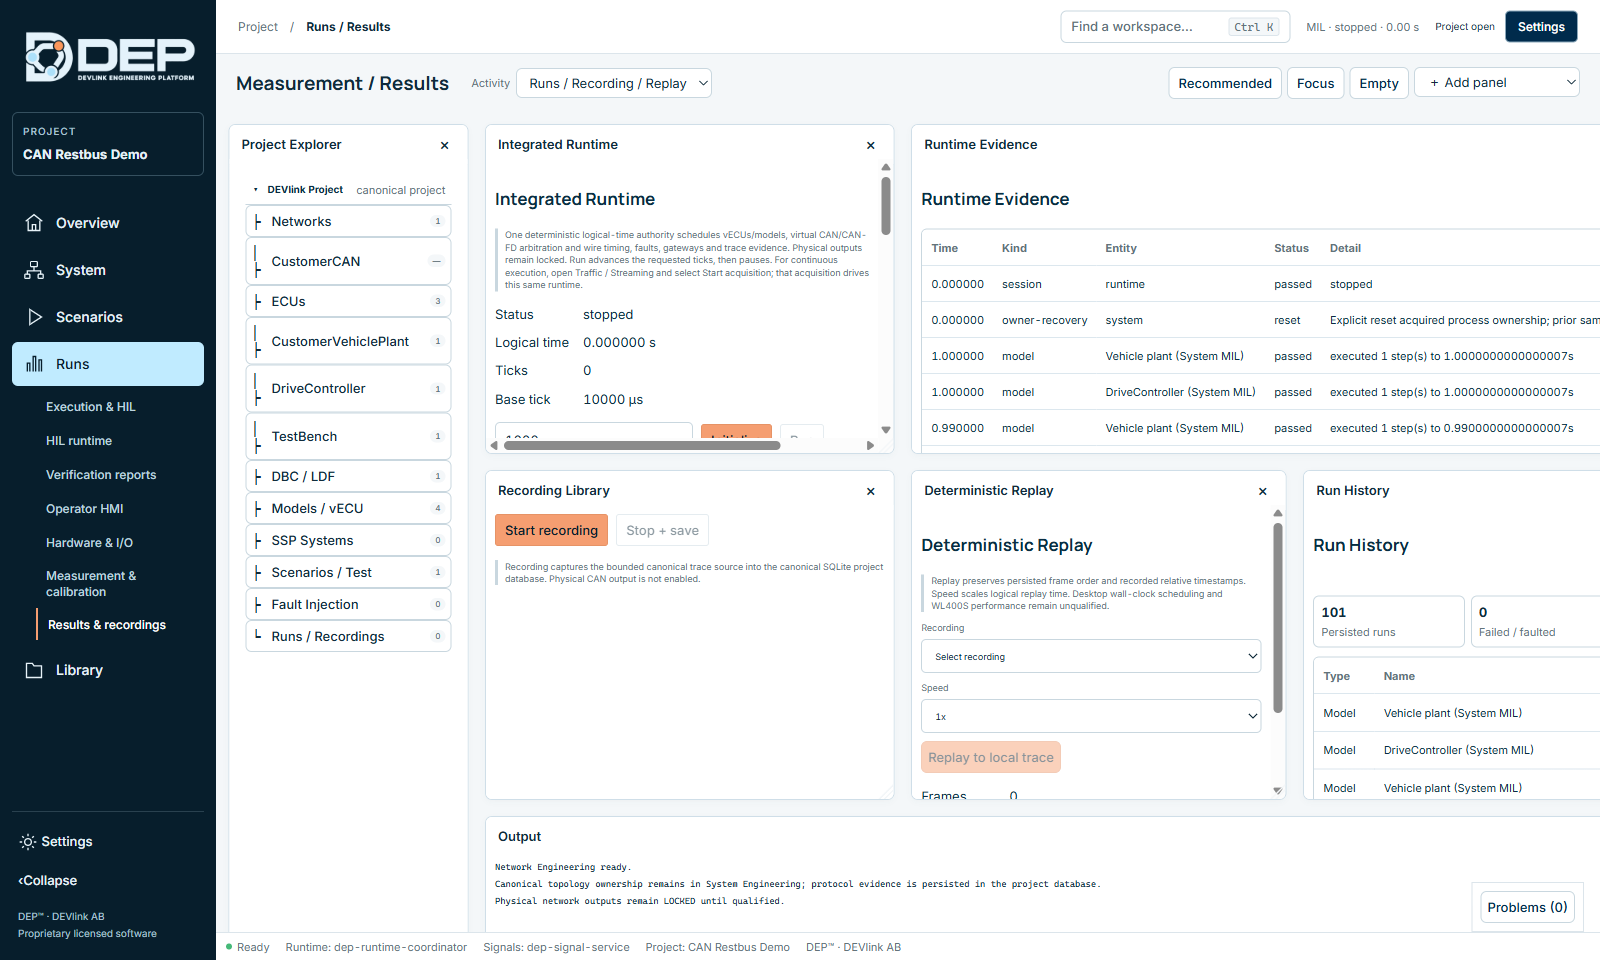
| Panel | Purpose |
|---|---|
| Project Explorer | The networks, ECUs, databases, models and vECUs, SSP systems, scenarios, faults and recordings in the project. |
| Integrated Runtime | The single logical-time authority for the restbus path. It schedules models and vECUs, virtual CAN/CAN FD arbitration and wire timing, faults, gateways and trace evidence. Shows status, logical time, ticks and base tick. Controls: Initialize, Single tick, Run ticks, Reset, Stop. Run advances the requested ticks and pauses. For continuous execution, use Start acquisition in Traffic / Streaming. |
| Runtime Evidence | Time-stamped records of what the runtime did: session state, owner recovery, model steps. |
| Recording Library | Start recording and Stop + save capture the bounded canonical trace into the project. |
| Deterministic Replay | Choose a recording and a Speed, then Replay to local trace. Replay keeps the recorded frame order and relative timestamps. |
| Run History | All persisted runs with counts of failed or faulted runs. Filter by All, Campaign or Model. |
Exports include CSV, Vector ASC and DEP recordings.