
Networks and Restbus (CAN)
DEP simulates vehicle and aircraft buses virtually. You can import a DBC database, let DEP play the ECUs that are not present (restbus simulation), generate signal values, and watch decoded traffic live. This chapter starts with a complete walk-through of the bundled CAN example, then describes each tool.
All buses in DEP are virtual. DEP does not connect to physical CAN, LIN or Ethernet buses, and the trace header always shows OUTPUT LOCKED.
Tutorial: the virtual CAN demo
The bundled project Virtual CAN controller and vehicle (CAN_Restbus_Demo.rbsproj) has three ECUs on the network CustomerCAN (CAN, 500 kbit/s) and five cyclic 100 ms messages:
| ID | Message | Transmitter | Receivers |
|---|---|---|---|
| 0x100 | DriverInput | TestBench | DriveController |
| 0x110 | RoadLoad | TestBench | CustomerVehiclePlant |
| 0x200 | DriveCommand | DriveController | CustomerVehiclePlant |
| 0x300 | VehicleState | CustomerVehiclePlant | DriveController, TestBench |
| 0x310 | ElectricalState | CustomerVehiclePlant | TestBench |
The demo is synthetic. It is not customer ECU software or a calibrated vehicle. The plant uses 1850 kg, a 0.33 m wheel radius and a constant 180 N road load.
Part A: run the System model (optional)
- Open the projectOverview → Projects → Open on Virtual CAN controller and vehicle. Save a working copy.
- Check and runOpen System → Check → Run. With the initial pedal of 35 %, DriveController outputs 140 Nm and the vehicle speed rises. See Results.
- Release the sessionSelect Reset & release session. This is required before Part B: the System run and the CAN acquisition are separate execution owners.
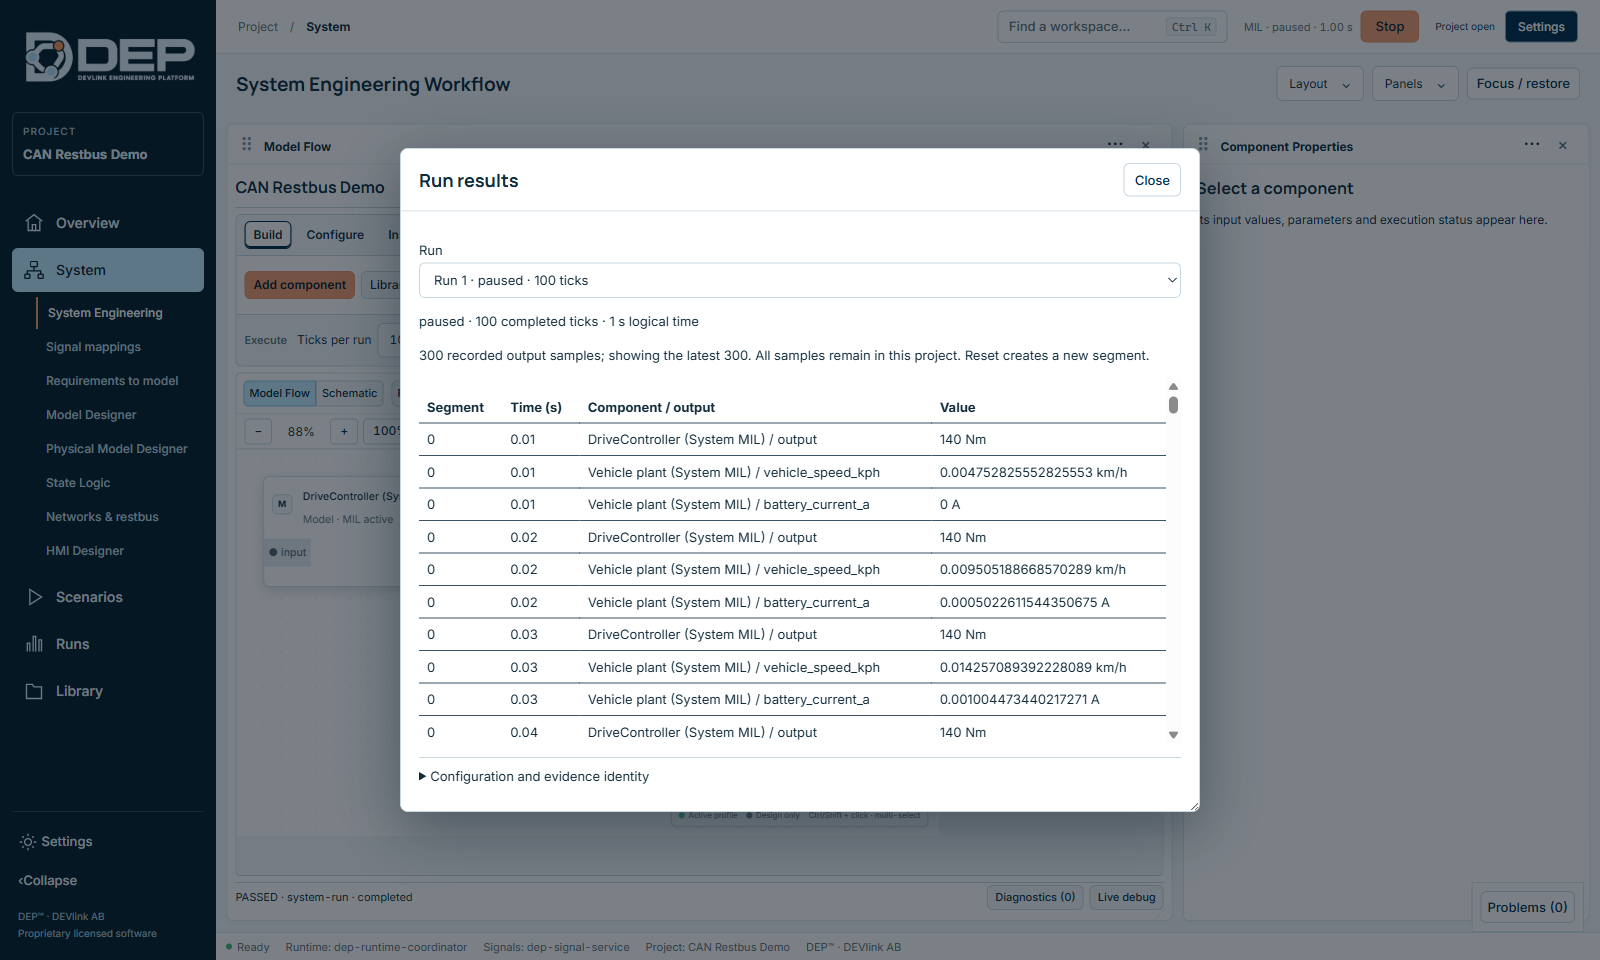
System Run does not drive this demo's CAN frames. The frames come from the restbus runtime started in Part B. Always stop the System before you start acquisition.
Part B: watch live CAN traffic
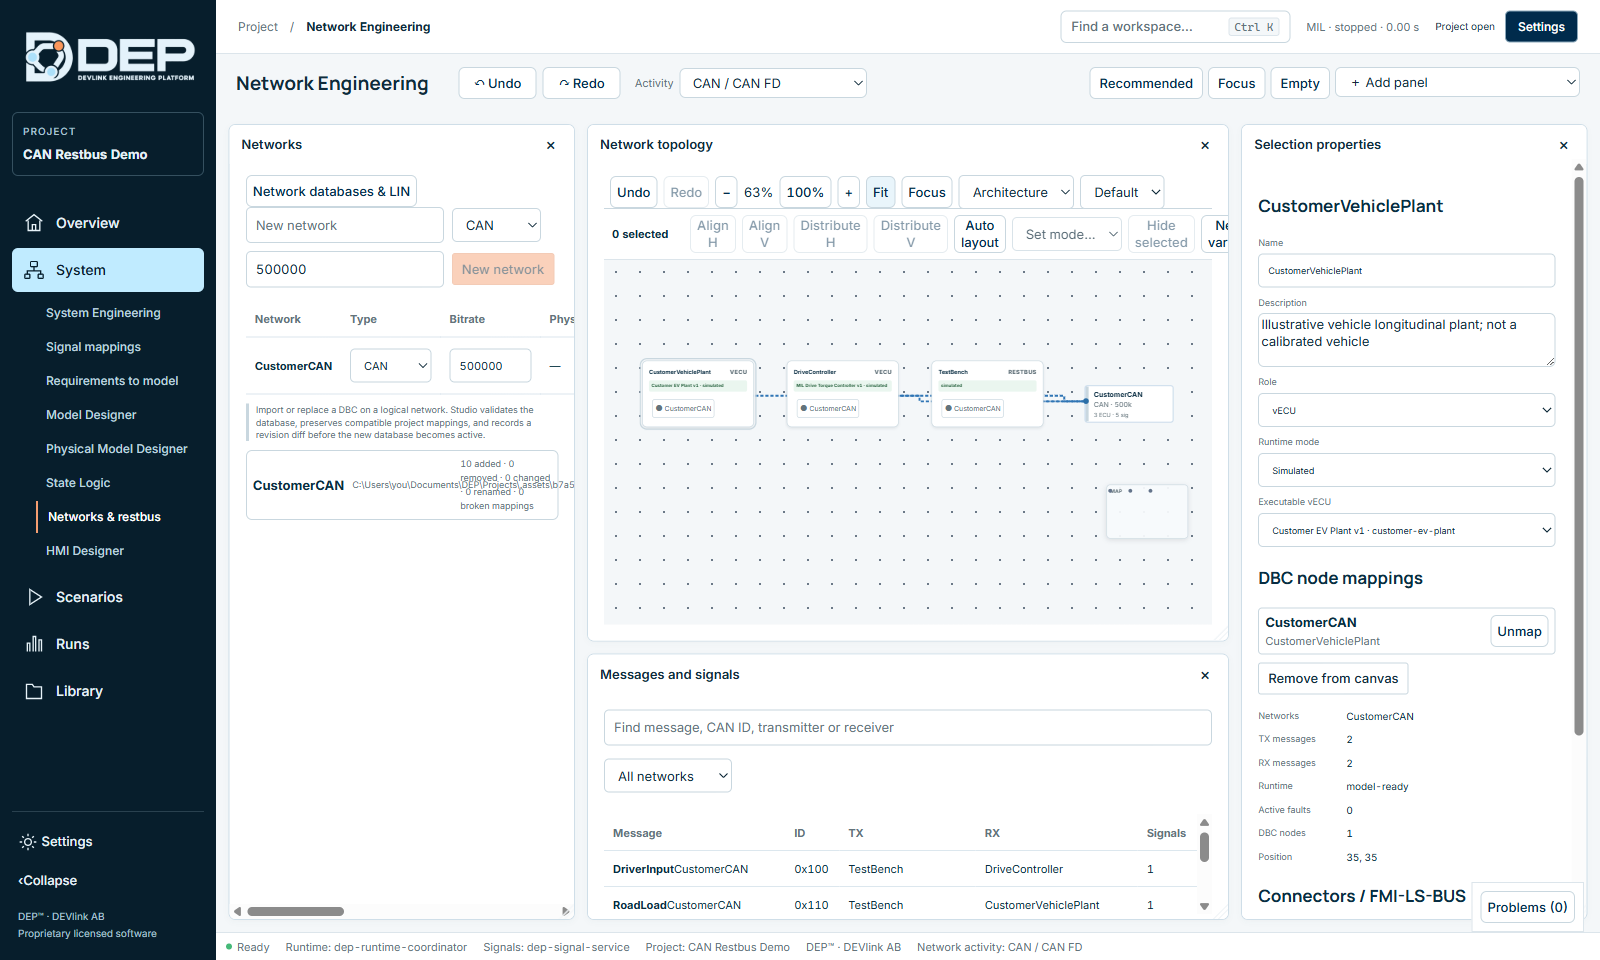
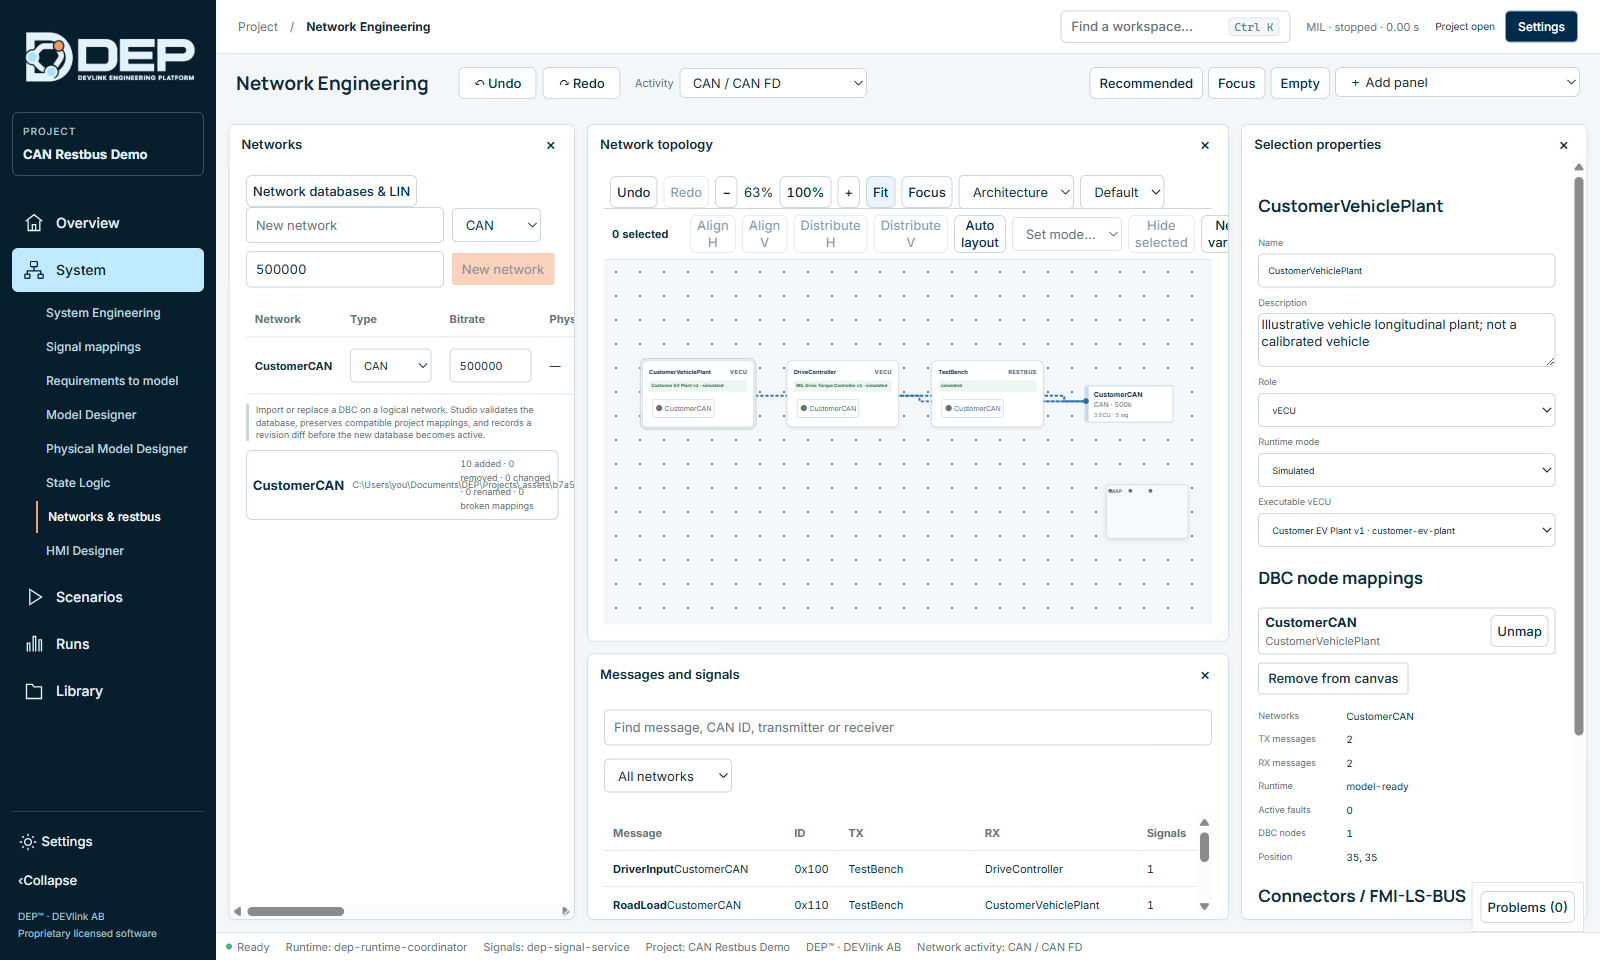
- Open the networkSelect System → Networks & restbus. In Activity choose CAN / CAN FD.
- Arrange the viewSelect Recommended in the toolbar. In Network topology, select Auto layout and then Fit. Three ECU cards appear: TestBench, DriveController and CustomerVehiclePlant.
- See the messagesClose Network topology with its ×. Messages and signals now lists all five messages with ID, TX, RX and signal count.
- Inspect the generatorSelect DriverInput, expand Details and transmission and select Configure transmission. DEP opens the integrated runtime, where the Accelerator_pct sine generator is already enabled.
- Start streamingReturn to System → Networks & restbus, choose the activity Traffic / Streaming and select Recommended. Keep Live local restbus runtime selected and select Start acquisition.
- ObserveFrames appear in CAN / CAN-FD Trace. DriverInput, DriveCommand, VehicleState and ElectricalState payloads change, while RoadLoad stays constant. Select a frame to see it decoded in Frame / Signal Detail.
- PauseSelect Pause before you leave the workspace. Acquisition stops and the local runtime pauses.
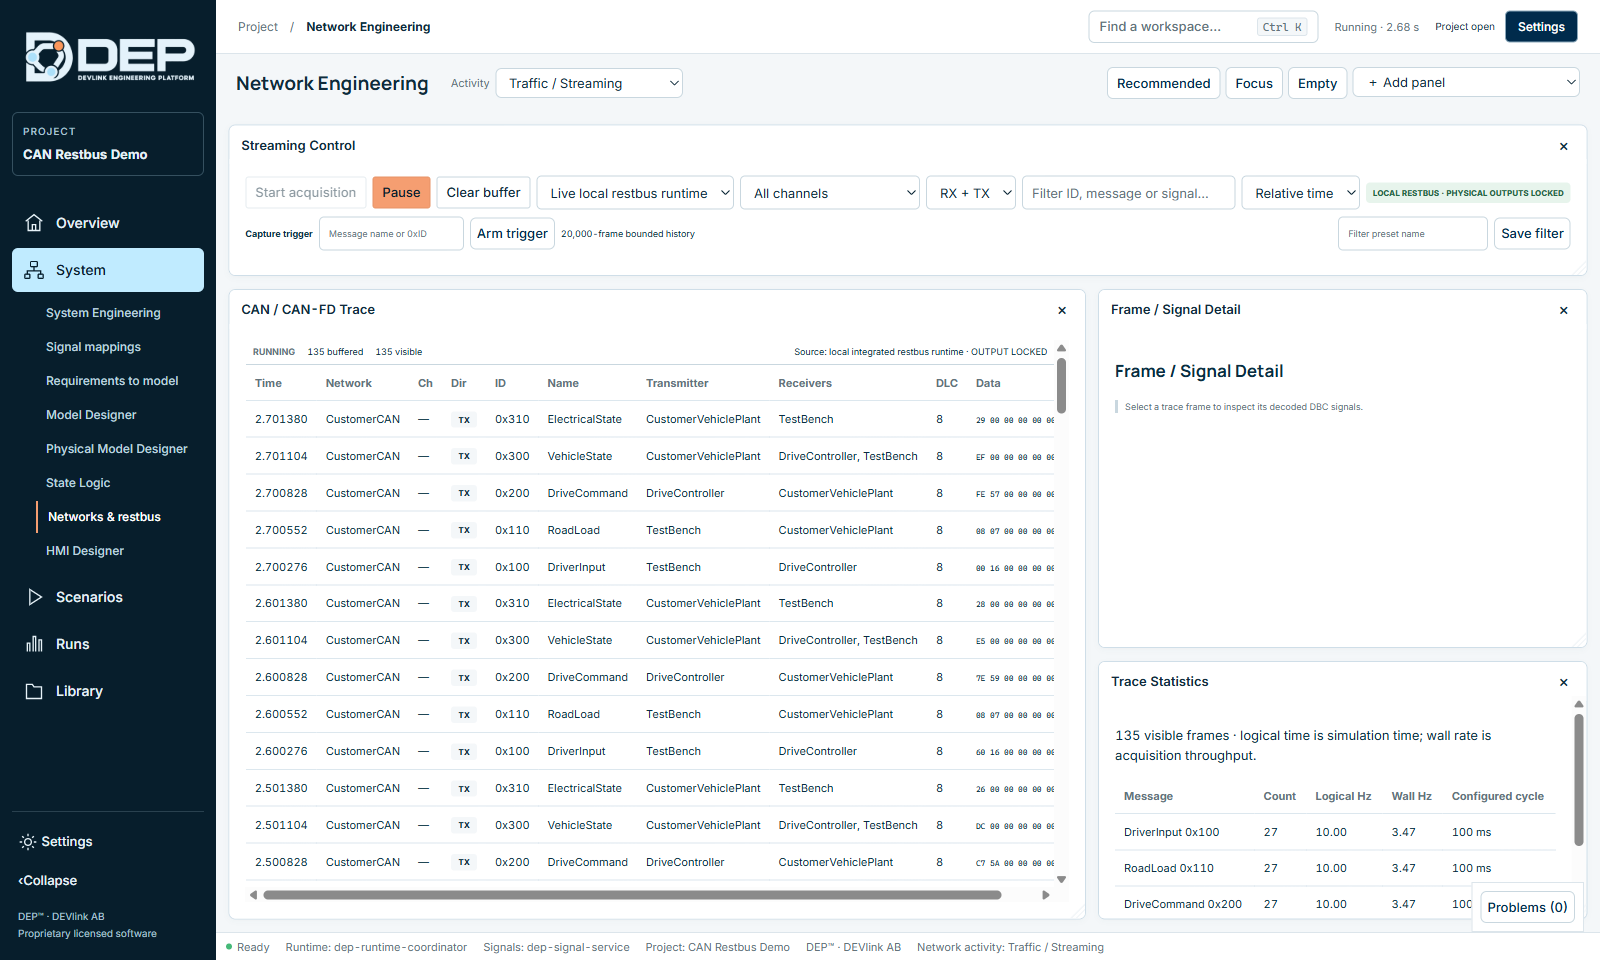
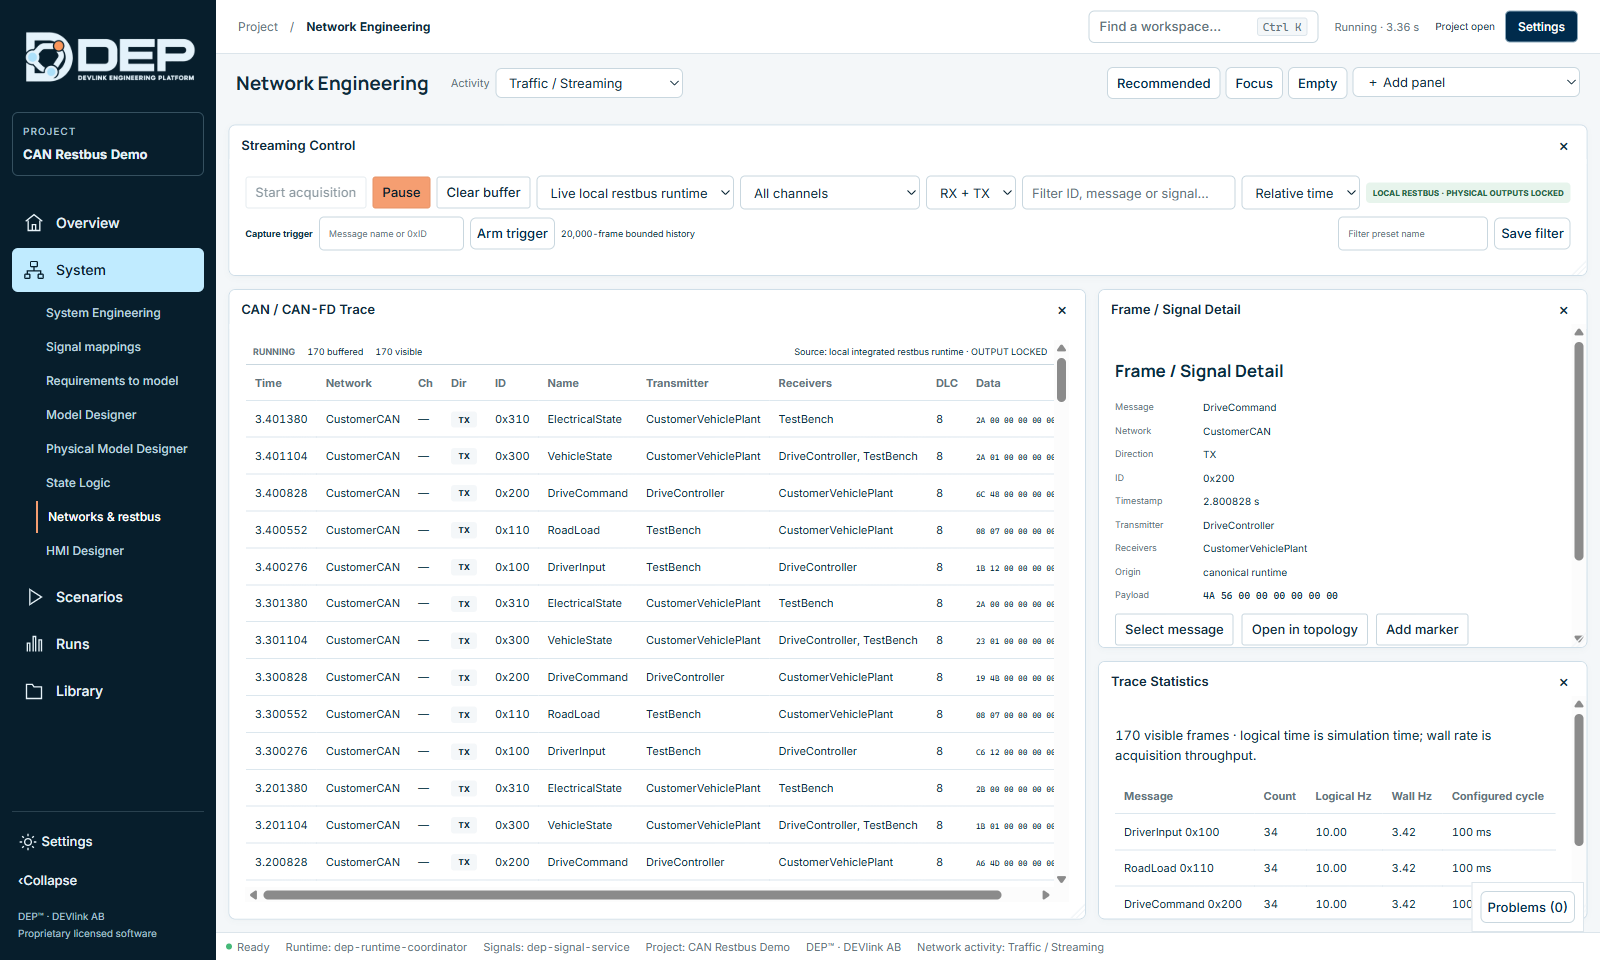
Trace Statistics shows for each message the count, Logical Hz (spacing in simulation time, about 10 Hz for 100 ms messages), Wall Hz (acquisition throughput on your PC) and the configured cycle. Starting acquisition clears the old trace buffer, so traces from different resets are never mixed.
Network overview
The default activity, Overview / Topology, summarises the networks in the active System revision: counts per protocol (CAN, CAN FD, LIN, Ethernet, EtherCAT, ARINC 429, ARINC 825) and tabs for Networks, Properties, Routes & mappings and Health & diagnostics. The overview is read-only. Use Edit topology in System Engineering to change it.
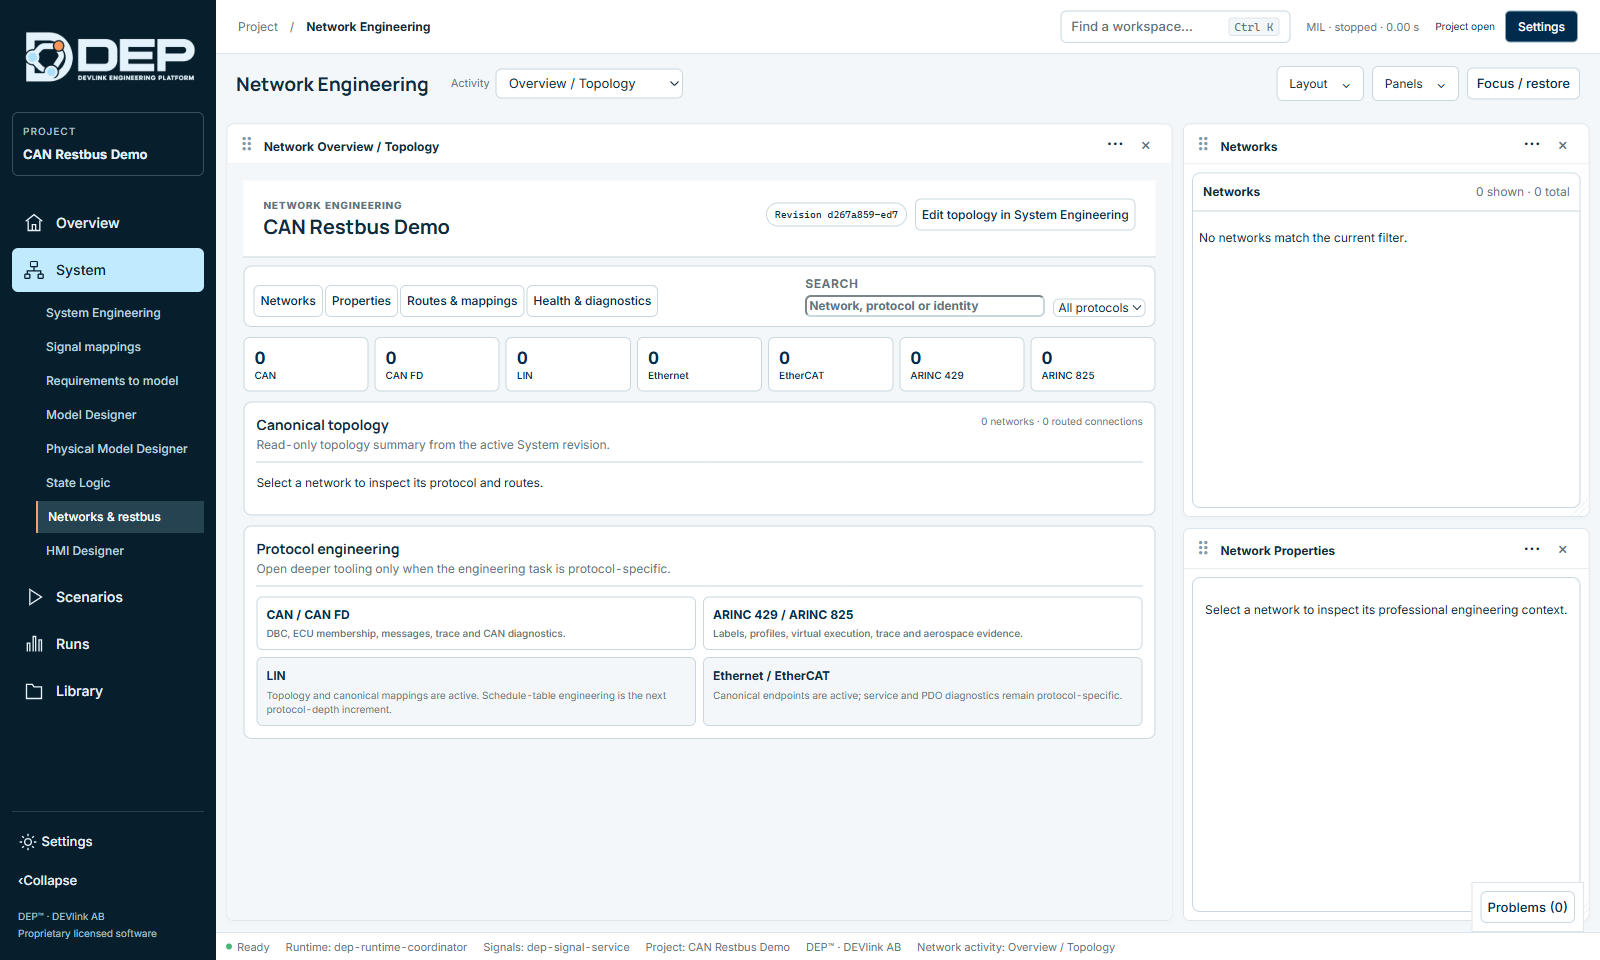
The Protocol engineering cards open deeper tools only when you need them: CAN / CAN FD (DBC, ECU membership, messages, trace and CAN diagnostics), ARINC 429 / ARINC 825 (labels, profiles, virtual execution, trace), LIN and Ethernet / EtherCAT.
Networks and DBC import
In the CAN / CAN FD activity, the Networks panel lists each network with type, bitrate, physical binding and database.
- New network: choose CAN or CAN FD, the bitrate and the backend (Virtual, or SocketCAN on Linux targets).
- Import DBC… or Replace: DEP validates the database, keeps compatible project mappings, and records a revision diff before the new database becomes active, for example 10 added · 0 removed · 0 changed · 0 renamed · 0 broken mappings. If a mapping cannot be kept automatically, resolve it with Controlled remapping / Remap.
- Delete removes the network after confirmation.
LIN and other databases are handled in the Network databases & LIN panel: DBC, LDF and FIBEX (CAN). Select Inspect database file, review the findings, then Apply reviewed import. For LIN you can Prepare network run, Step ticks, Apply fault, Export LIN history and Load LIN replay.
ECUs and topology
- New ECU adds an ECU. Select an ECU to edit its Selection properties: name, description, role (External ECU, Restbus simulated, vECU, SIL process, Physical ECU, Monitor only) and Runtime mode.
- Set mode…: Real, Simulated, Monitor or Disabled. A simulated ECU is played by DEP's restbus. A disabled ECU sends nothing.
- Executable vECU: assign the model or software that computes the ECU's signals.
- DBC node mappings: tie the ECU to a node of the database (Map imported DBC node / Unmap).
- Layout tools: Align H, Align V, Distribute H, Distribute V, Auto layout, Hide selected, New variant.
- Overlay tabs above the canvas: Architecture, Ownership, Traffic, Runtime, Errors, Deployment.
- Import topology / Export topology exchange the topology as a file. Add gateway route forwards messages between networks.
Message transmission and generators
Select a message, expand Details and transmission and select Configure transmission.
| Setting | Options |
|---|---|
| Tx mode | Cyclic, Event-triggered, Cyclic + event, On change, RX-triggered, Manual |
| Timing | Cycle time and delays |
| Alive counter | Adds a rolling counter signal |
| CRC | XOR-8, SUM-8, SAE J1850 CRC-8 |
| Actions | Apply Tx configuration, Trigger manually |
Signal generators produce values for simulated ECUs: Constant, Ramp, Sine, Square, Repeating table and Scripted sequence. Select Enable generator to activate one. Import trace → stimulation replays a recorded trace as stimulus.
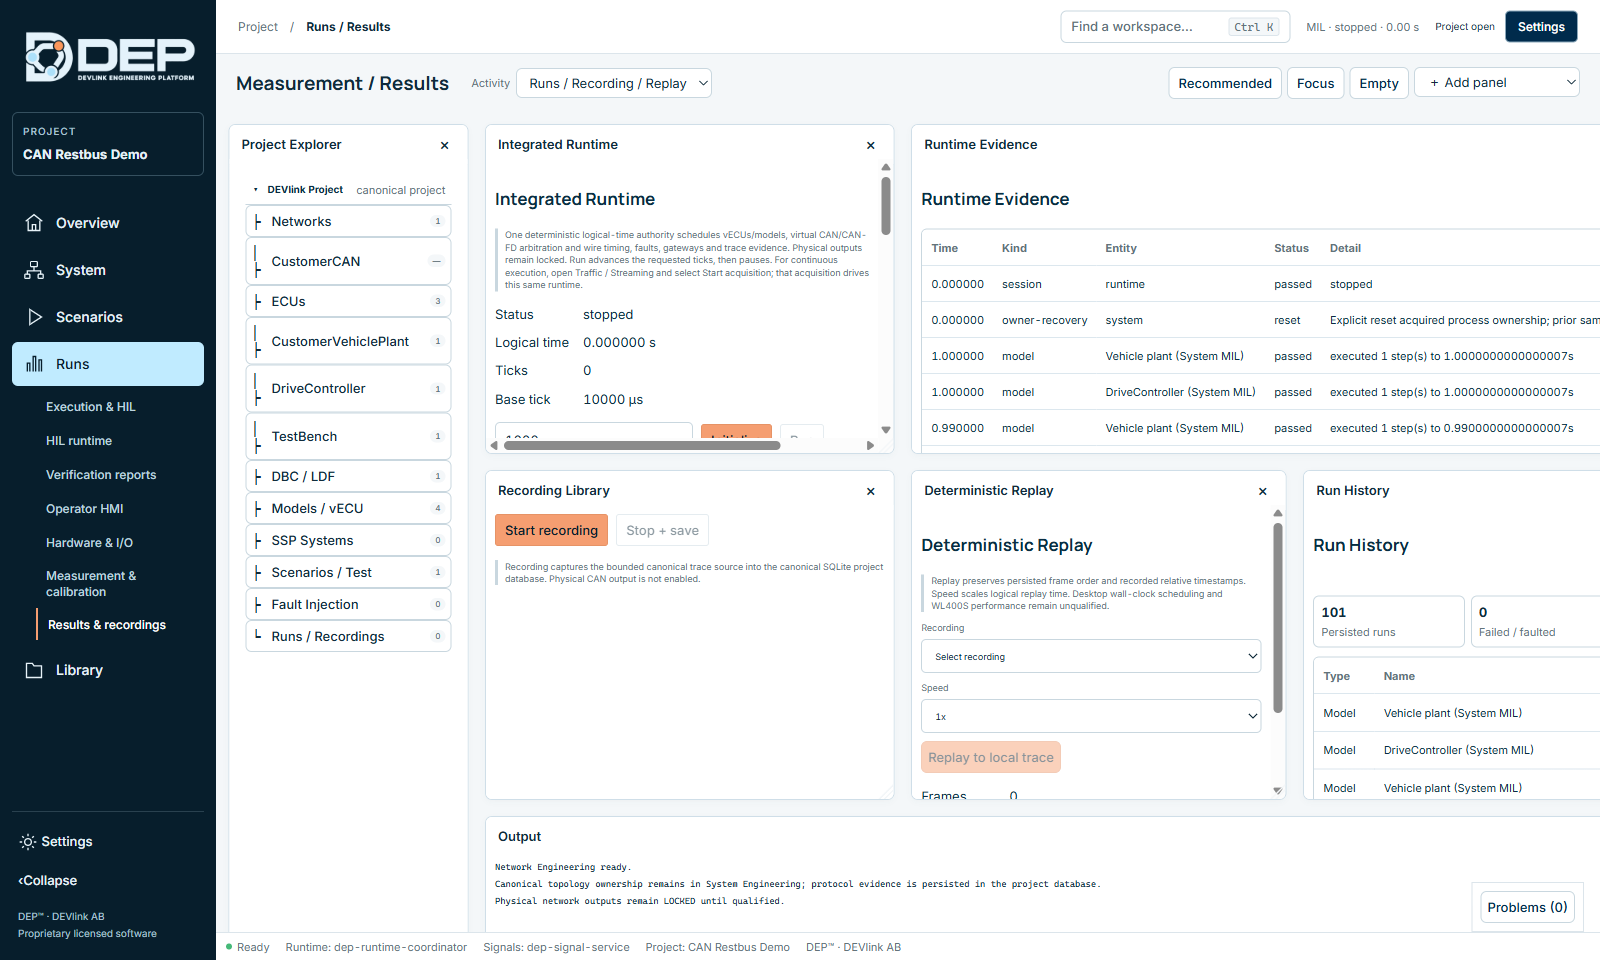
Traffic / Streaming
| Control | Purpose |
|---|---|
| Start acquisition / Pause | Start or pause the local restbus runtime and the capture. |
| Clear buffer | Empty the trace (20,000-frame bounded history). |
| Source | Live local restbus runtime |
| Channel, direction, filter | All channels or one network; RX + TX, RX or TX; filter by ID, message or signal. |
| Time | Relative time, Delta time or Wall clock. |
| Capture trigger / Arm trigger | Start capturing when a message name or ID appears. |
| Save filter | Store the current filter as a named preset. |
| Frame detail | Select message, Open in topology, Add marker. |
If no messages are configured, streaming shows No messages configured — import a DBC in Topology. If another runtime owns execution, acquisition refuses to start. Stop that owner first. A faulted restbus must be reviewed and reset in the integrated runtime (Runs → Results & recordings, activity Runs / Recording / Replay).
Network analysis
The NETWORK ANALYSIS panel of the CAN activity shows bus load, frame rate, timing and CAN state for each network.
ARINC 429 and ARINC 825
Choose the activity ARINC 429 / ARINC 825 to work with labels, profiles, virtual execution and traces. ARINC is virtual only, and DEP does not connect to aerospace hardware (OUTPUTS LOCKED). The Aircraft ARINC Roll and ElectricAircraft examples use virtual ARINC buses.
Connecting buses to models
Models exchange values with buses through Signal Mappings, and in the integrated runtime through Signal Bindings (Library → Software / FMI / SSP: model variable ↔ restbus signal, with optional scale and offset).